Doughnut chart. I would rate the Building Control service at Fylde as:. Data table with 5 rows and 2 columns follows.
| Excellent | 14 |
|---|---|
| Good | 37 |
| Satisfactory | 67 |
| Poor | 71 |
| Very poor | 45 |
– Building Control

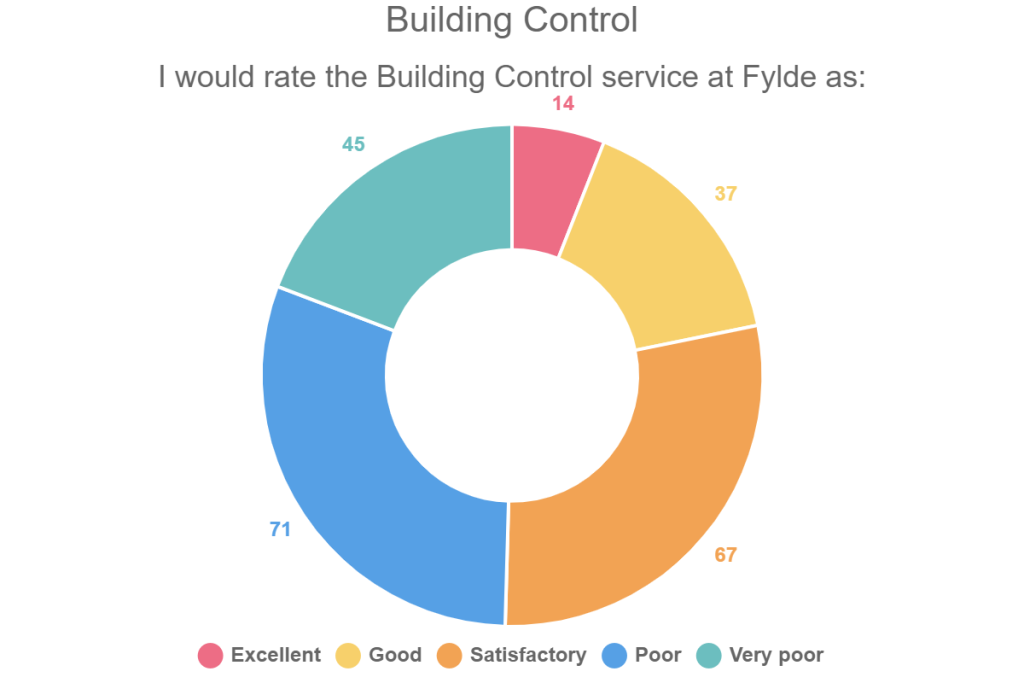
Doughnut chart. I would rate the Building Control service at Fylde as:. Data table with 5 rows and 2 columns follows.
| Excellent | 14 |
|---|---|
| Good | 37 |
| Satisfactory | 67 |
| Poor | 71 |
| Very poor | 45 |


